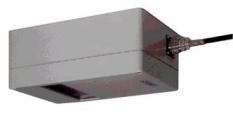
| Optical axis scanning by a rotating mirror |
| Cooling type PbS |
| 90° |
| 5 times/second or 10 times/second (to be specified) |
| Narrow-band type radiation thermometer |
| 100 to 600°C |
Less than 400°C: ±4°C
400°C or higher: ±1.0% of measured value
(atε= 1, ambient temperature 23°C ± 5°C) |
Less than 400°C: 3°C
400°C or higher: 2°C |
| 1.0 to 0.2 |
| 0.5m to ∞ |
| Measuring distance L (mm)/Distance factor 150 |
| 0.5ms (90% response) |
Direct viewfinder or laser spot (option)
Laser ON/OFF by switch, Laser: less than 1mW, 645mm, class 2 |
| Temperature pattern: 0 to 20mADC, Peak temperature: 4 to 20mADC, Scanning angle: Open collector (max load voltage 35VDC, max load current 10mADC) |
| 4 to 20mADC |
| 0 to 50°C |
| 100 to 240VAC |
| +10% to 15% of rated value |
| About 40VA |
| Connector connection |
| Exclusive cable, maximum 200m |
| Aluminum/gray |
| 300W x 200H x 120Dmm, about 6.5kg |
| Windows95 or WindowsNT4.0 (to be specified) |
| 800 x 600 dots |
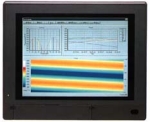
| Thermal-image display in pattern, trend and color modes |
| 0 to 5VDC (adding 250Ω to 4 to 20mADC from scanning unit) |
| 0 to 5VDC (without isolation) |
| (1) 7 position points + 1 peak point or (2) 3 zone peak points at sampling mode |
| Built-in thermal-image software |
| 100 to 240VAC 50/60Hz |
| About 8.5kg |
| Kiln shell hot spot monitoring (Zone peak temperature graph, thermal-image display, historical display, report output) |
| At each 2-rotation of kiln |
Hot detection at the maximum temperature in each zone (with a function detecting rate-of-change)
Zone division: 20 divisions (optional position setting)
Hot detection: Alarm setting temperature Zone maximum temperature, Alarm setting: Setting at each zone
Radiation temperature measuring range: 0.1°C increment |
| 250 times/1 kiln rotation |
| Color/°C (400 colors in case of measuring range of 100 to 600°C) |
Main screen
(1) Data display: Zone peak temperature bar graph, Extensive thermal-image
(2) Function button: Settings, Start/stop of measurement, History, Quit
(3) Operation status (measuring, waiting) |
| Alarm setting |
Zone maximum/minimum temperature per hour, Each zone maximum temperature per day, Extensive thermal-image at detection of maximum temperature per day, Maximum/minimum/average temperature pattern per day, Semipermanent storage (about 1GB exclusive file in year)
Storage type: Exclusive file (automatic storage, for replay), Excel 97 type file (each 1 hour data base, trend data) |
Data base replay/display at historical mode, Printer output of report
(1) Data viewer: List display of stored data
Data per day: Date, time, maximum temperature, its generated zone
Extensive thermal-image: Thermal-image at detection of maximum temperature per day
Data/hour: List display of maximum temperature per hour of each zone (generated data identification enabled)
(2) Pattern data reading screen
Maximum/minimum/average temperature pattern per day, alarm/zone, setting temperature display, printing
(3) Report: Display of daily report, monthly report, image report (per day), Printer output
(4) Trend: Historical trend of peak temperature of each zone, Printer output (with functions of time-axis expansion and scroll) |